OpenTelemetry
OpenTelemetry is a collection of APIs, SDKs, and tools to instrument, generate, collect, and export telemetry data (metrics, logs, and traces) that help us analyze application performance and behavior.
Traces
We provide a tracing implementation as a means to gain view into the system performance and bottlenecks. You can configure the collectors through application configuration
Future plans
You can specify the custom headers that you want to transfer through the application.
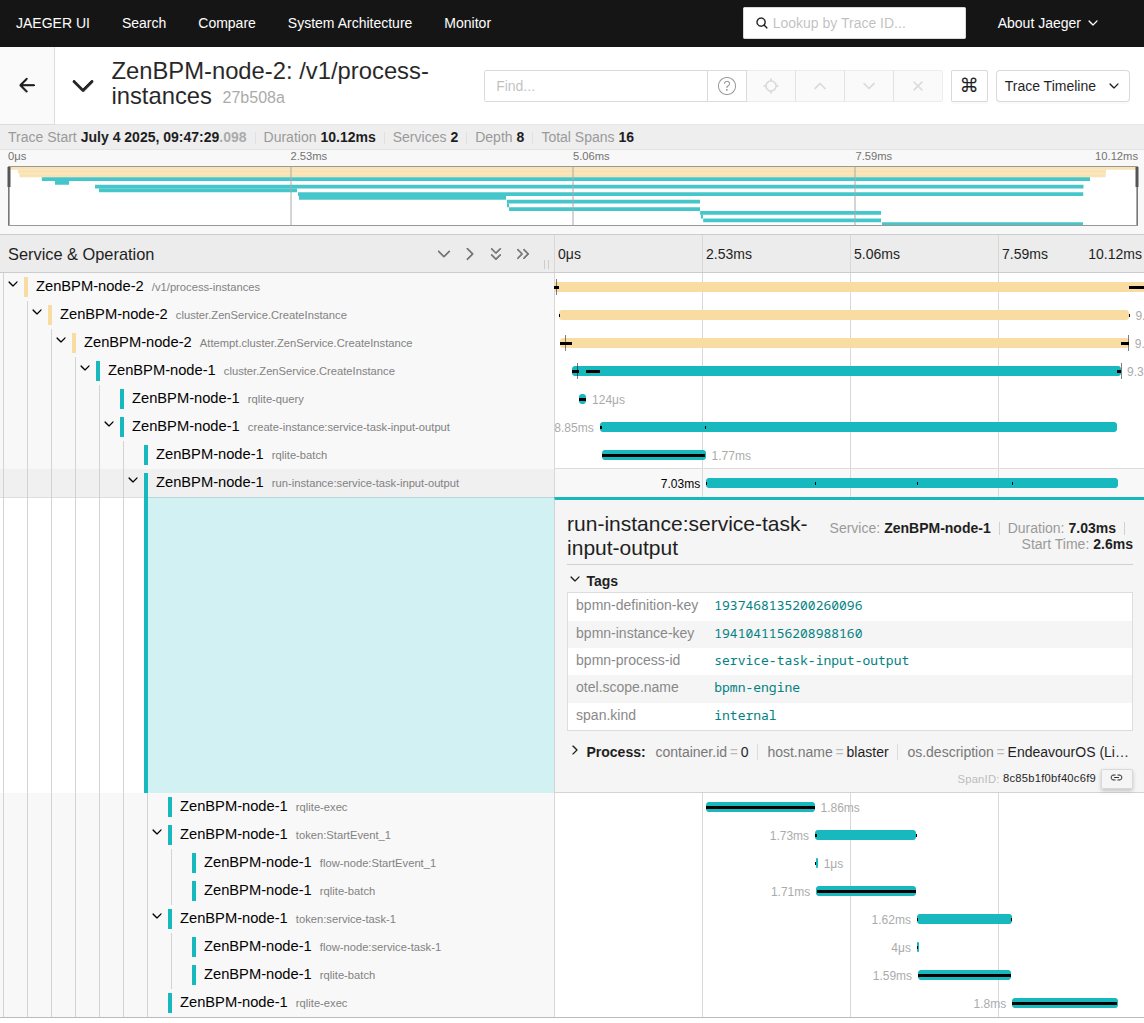
Example trace of the start of process instance
Metrics
Metrics provide an insight into the platform over time. We provide metrics such as:
- request rates
- request duration
- error counts
- memory usage
- bpmn metrics
- dmn metrics
They are are available at:
- REST(prometheus exporter):
/system/metrics